
You’ve spent months building and rolling out a training program, and the company has invested thousands of dollars into making it work—only for it to be a complete flop. Unfortunately, this is an all-too-common scenario among L&D professionals, with only 10% of corporate learning deemed effective.
The problem? Training programs are often disconnected from business outcomes. And when you can’t show the impact of your efforts, it becomes harder to prove that your program actually works. The question remains: How to show the C-Suite that your work matters? The answer lies in measuring the right L&D metrics.
Learning analytics is less about numbers and more about what you do with the data. In the simplest terms, learning analytics refers to capturing and analyzing data about learners and their learning environments. The ultimate goal is to understand and improve learning outcomes based on your collected data.
Ultimately, learning analytics is an essential part of an LMS. It’s about looking at the L&D metrics, making sense of your e-learning data, and understanding how engaged your employees are, how they retain knowledge, and whether the skills they’ve learned are effectively developed afterward. This can be the difference between a failed or a successful online training program.
Data can help you understand the performance of the program, identify bottlenecks in learning, review learning KPIs, evaluate the effectiveness of your course, and make data-driven decisions.
With WeSchool’s Learning Analytics, tracking the success of your training courses has never been easier. Let’s take a look at how you can use WeSchool to track the success of your L&D initiatives with the right learning KPIs.
Company heads care most about how teams and departments contribute toward business goals. Your L&D programs should be business-aligned, and the data you deliver needs to reflect this.
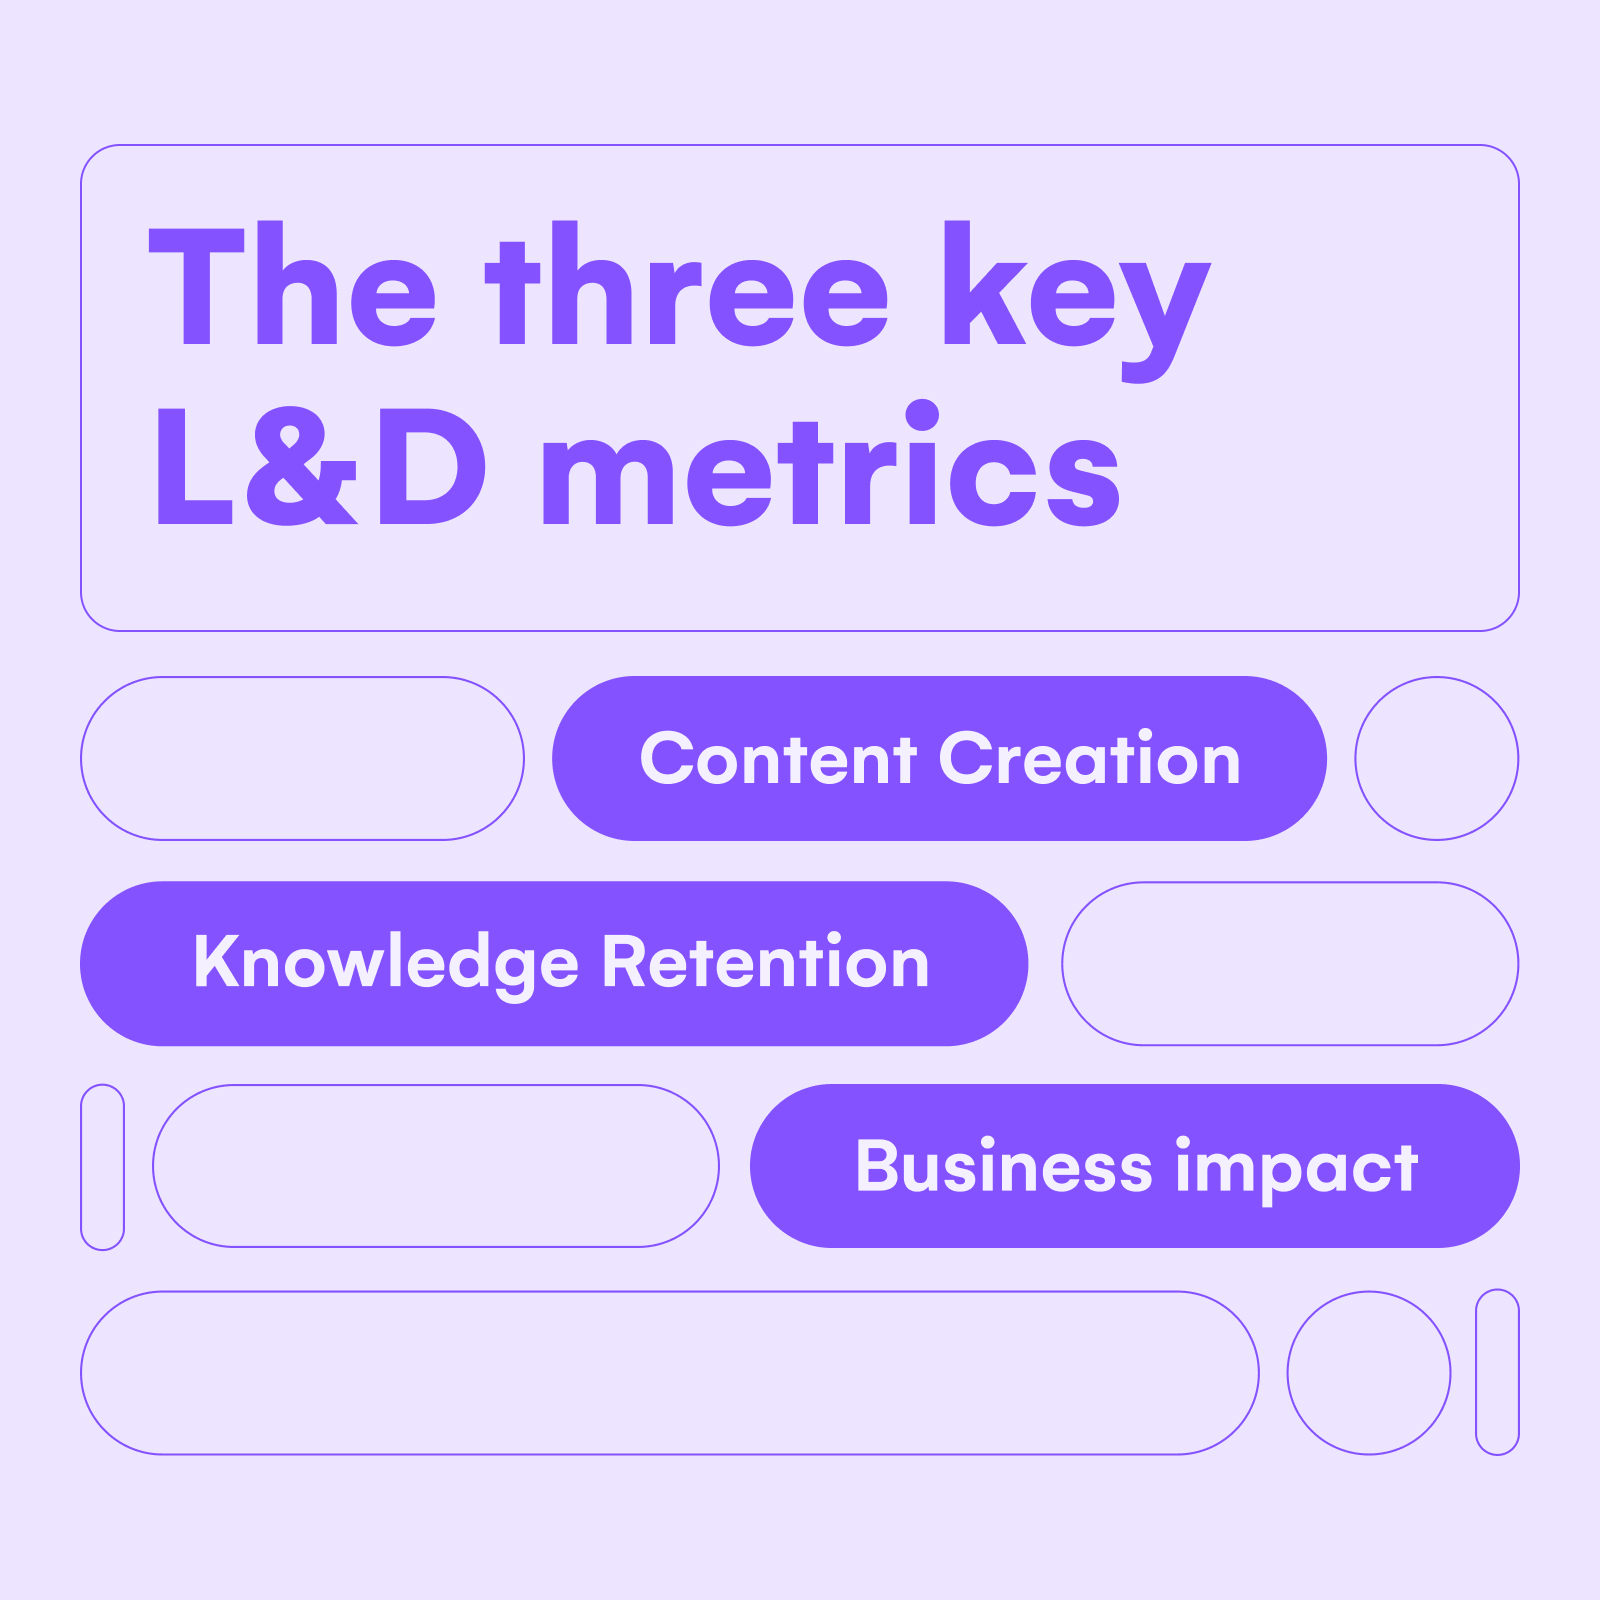
For best results, focus on the data that illustrates the effectiveness of your learning and development training program. This includes learner engagement, knowledge retention, and skills learned.
Learner engagement metrics offer a window into your team’s engagement and commitment to learning. It helps you assess the quality and effectiveness of your learning content and curriculum. In a nutshell, you can measure how engaged your learners feel by looking at core indicators like course effectiveness.
In any company that’s allocating resources to learning and development programs, it’s essential to show the C-Suite that those resources aren’t a waste. A high use and completion rate usually indicates high employee engagement and a positive experience.

Gives you a basic overview of how engaging your training course is. For example, if 65% of your employees fail to complete the onboarding program, then chances are your onboarding material is either too complicated or lacks luster.
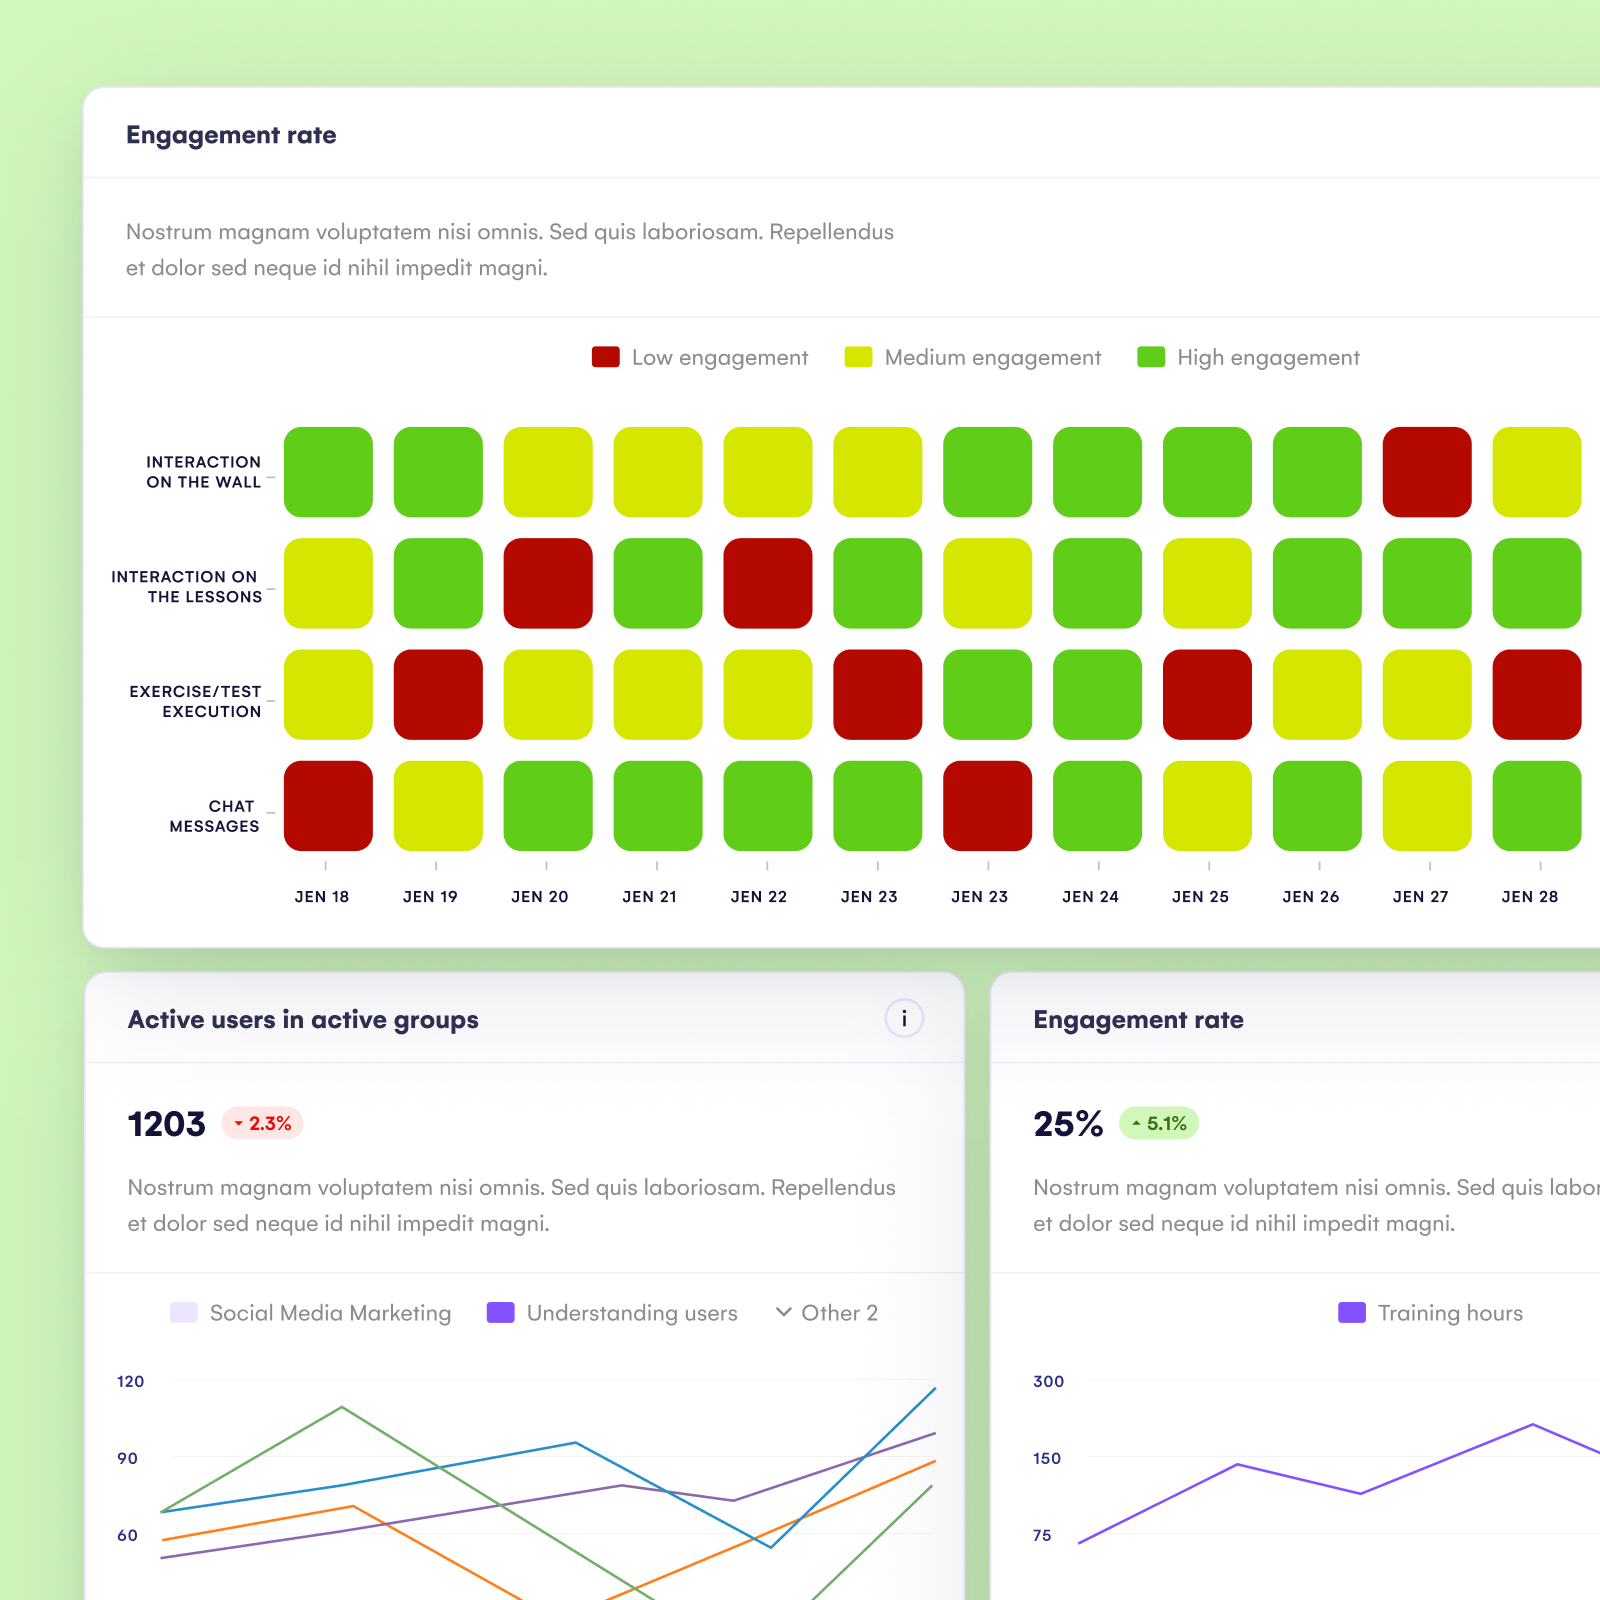
How immersed are your learners? You can easily track engagement by looking at data like participation in real-time discussions or how a learner behaves when interacting with an activity.
A telltale sign that your learners are engaged is when they leave a lot of comments, feedback, and questions with the respective content they are interacting with. This is usually a good indicator that your learner is engaged with the material.
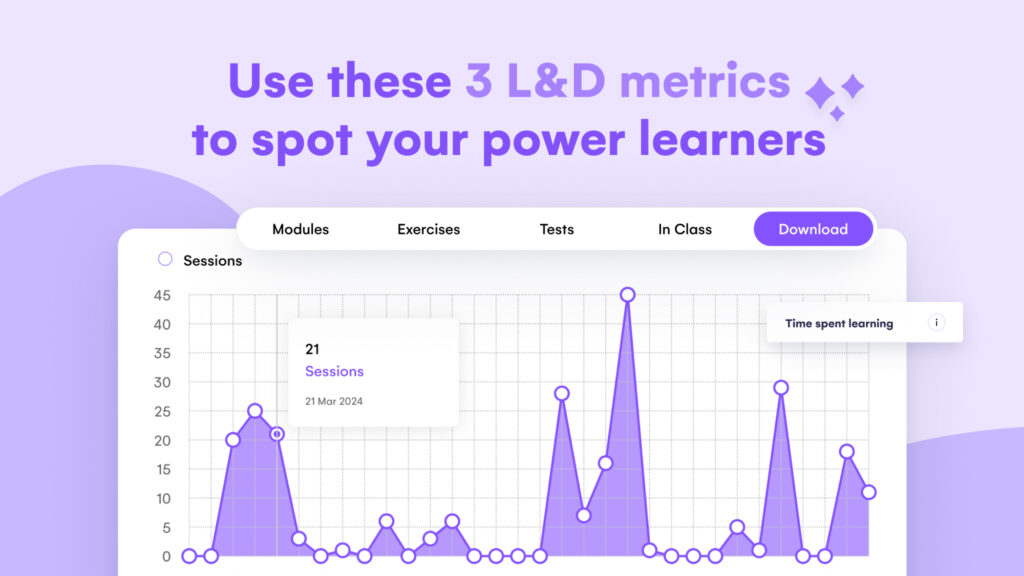
How engaged are your learners? WeSchool can help you define exactly what a power learner looks like. It can also help you easily spot which learners are experiencing problems, and how to address individual learner needs.
1. Get a 360-degree view of how users are engaging with your content
In the Management Dashboard, track engagement rates based on user interactions. Everything from total training hours spent on a module to seeing the total number of content interactions a user has had, get a quick understanding of how course content is performing.
2. Customize viewing options
You don’t have to be a data scientist to understand what the information means. Tailor your analytics to suit your needs with customizable viewing options.
3. Visually outline your users’ learning journey and intervene faster
No need to guess anymore whether your training program works. Quickly see how fast users learn by viewing learner engagement by module, exercises completed, tests taken, and in-class activity.
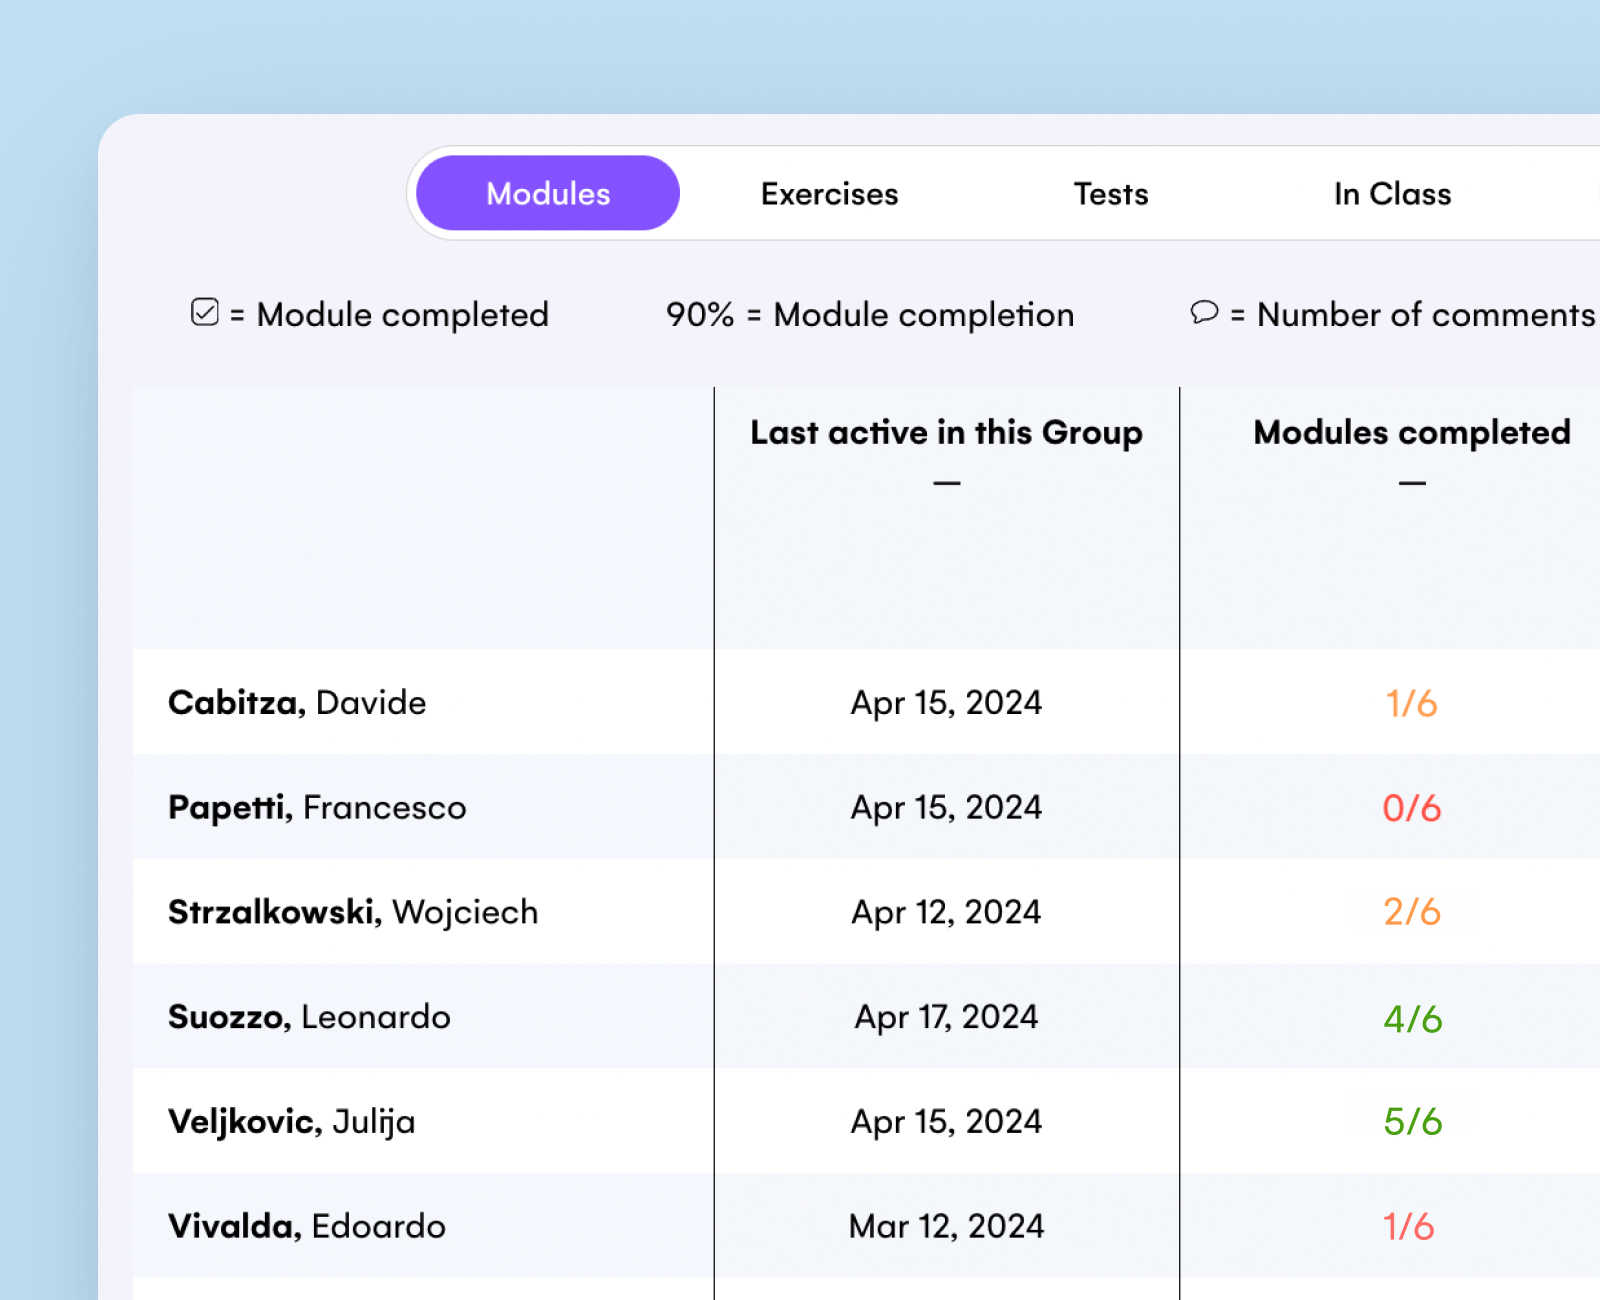
4. Grab engagement insights with the click of a button
See core metrics in action like modules completion rate, number of comments given and the activity history of each user.
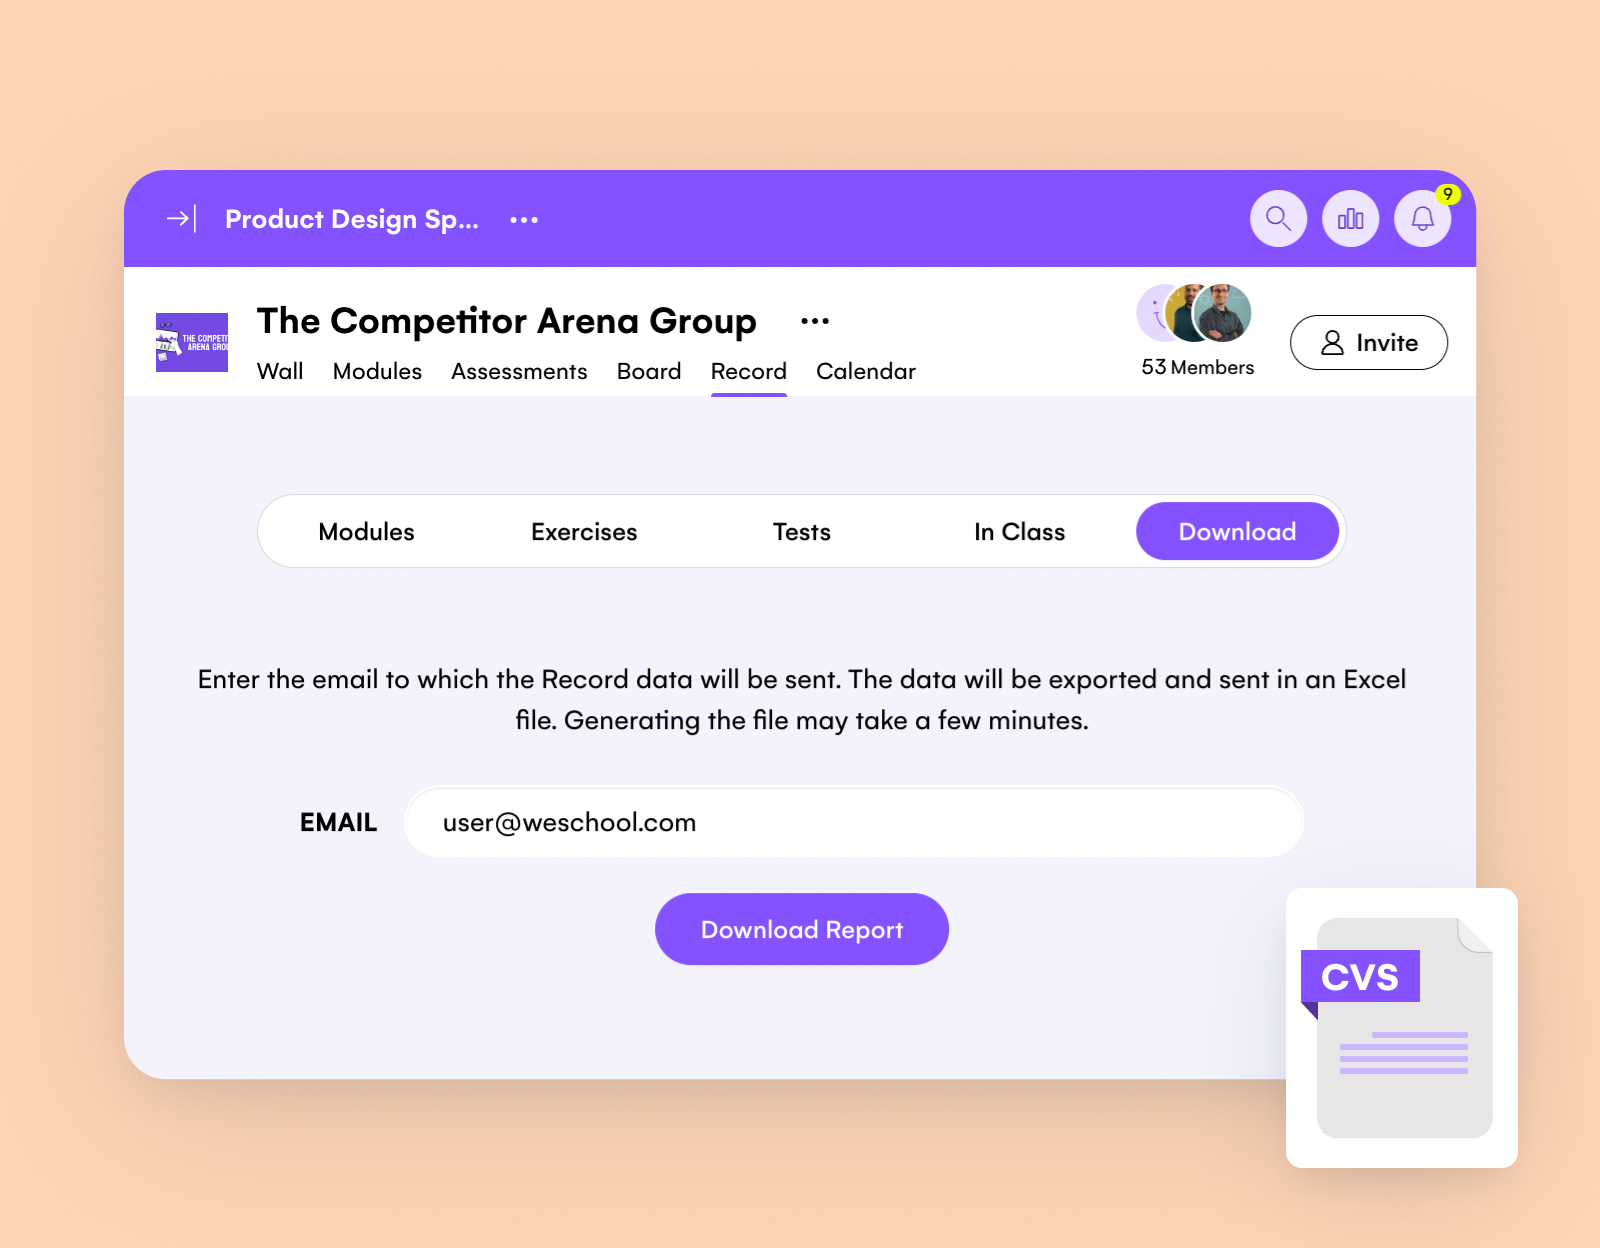
5. Say goodbye to reporting fatigue
Instead of trying to make sense of the data, we do this for you. Simply download all the learning analytics from Record in Excel format.
What a waste of time and money it would be to create a training program that fails to do what it’s meant to: upskill or reskill your employees. Knowledge retention is a metric that allows you to measure how well employees have learned how to do their job. It helps you measure how staff retain core knowledge, job tasks, and behaviors.
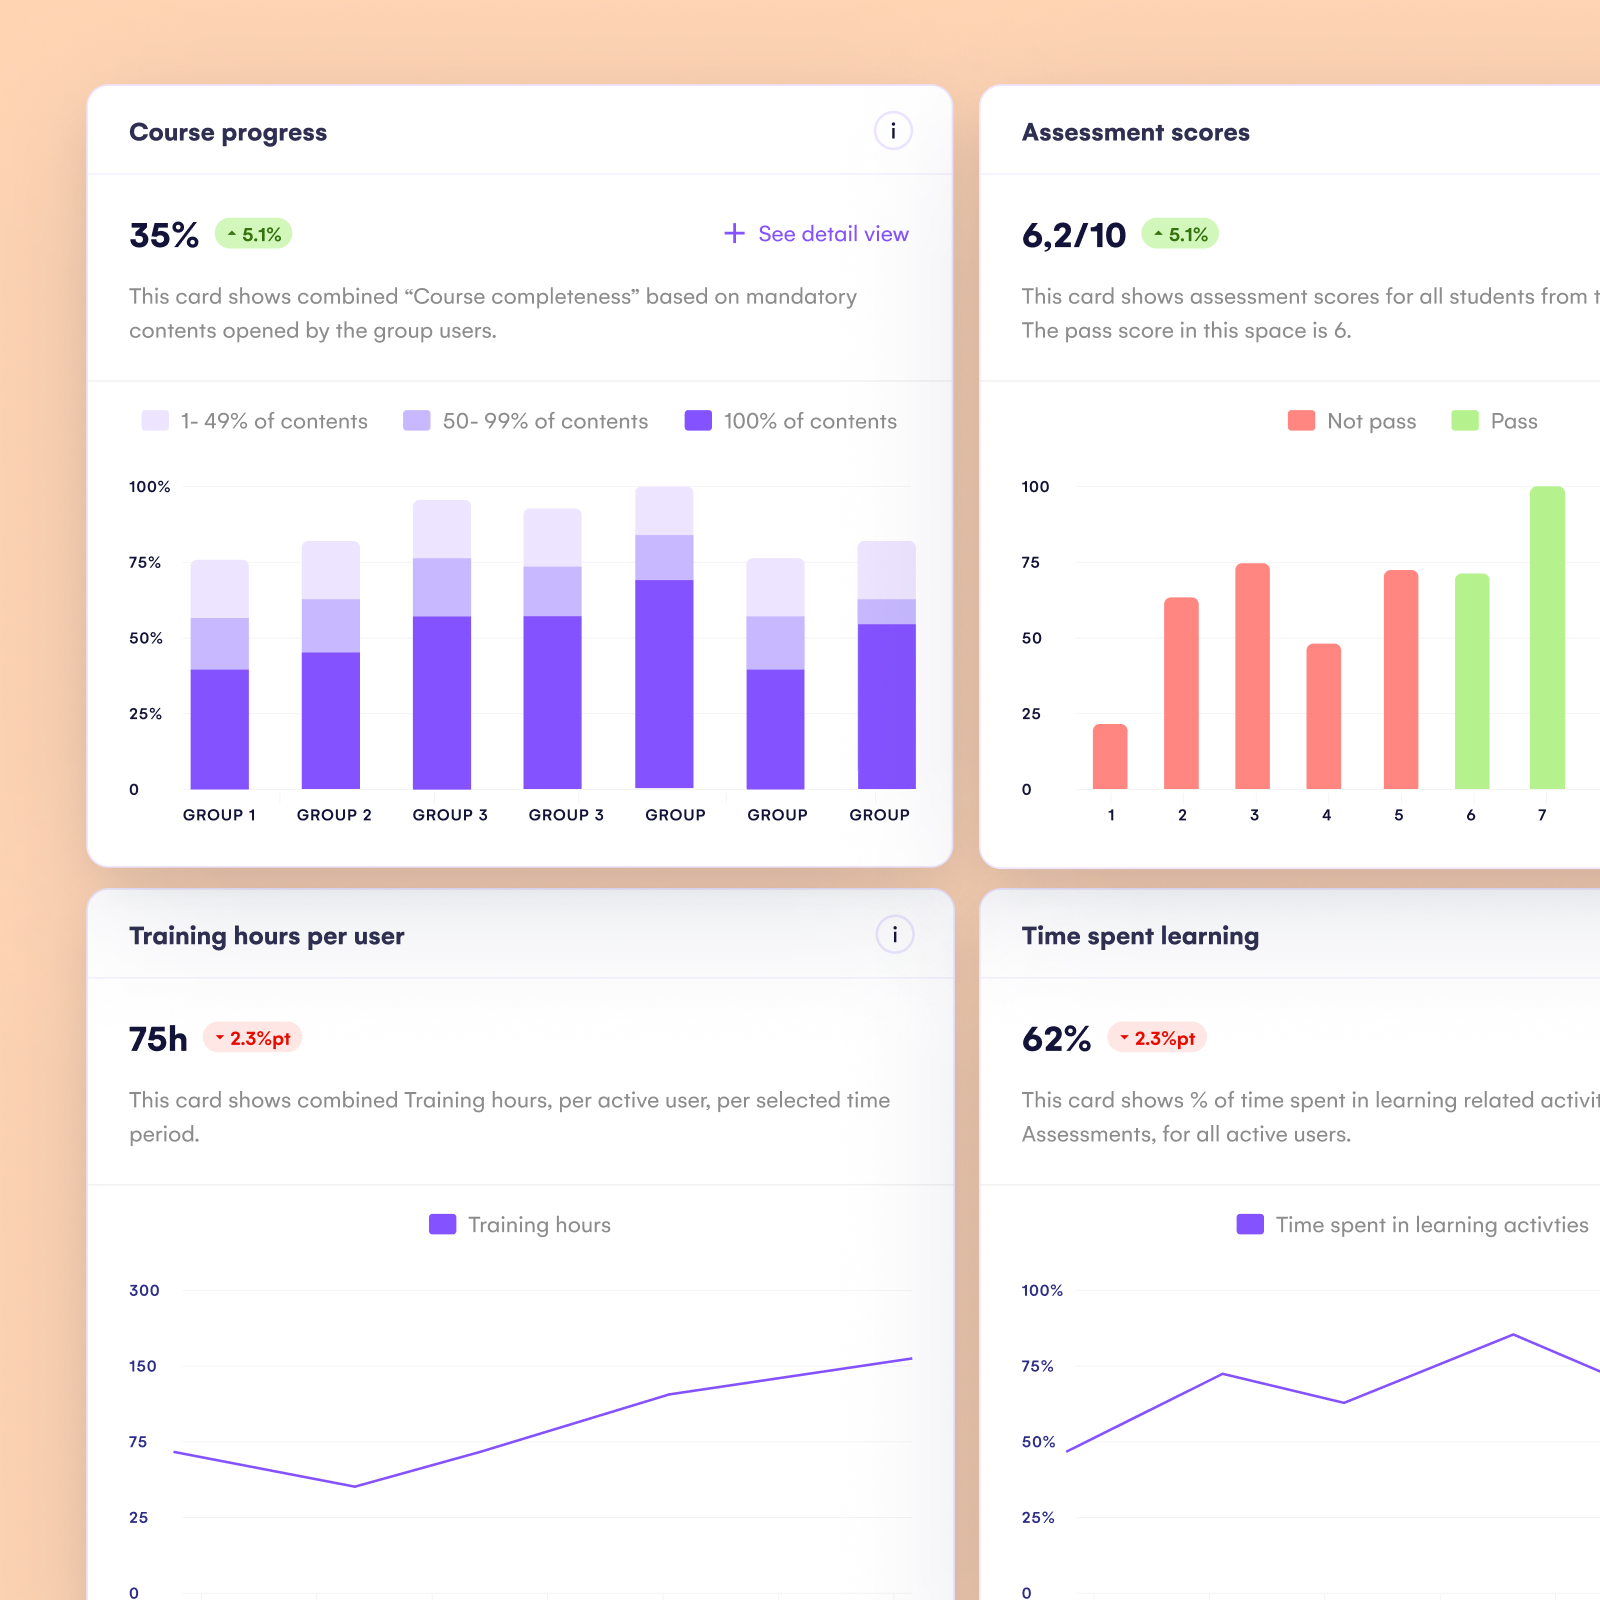
In particular, this L&D metric is useful when measuring how knowledge is retained and acquired when conducting team trainings. Say you’re rolling out a mandatory compliance training course. You ask 80 learners to complete a quiz, but only 60% pass the course. Chances are, your assessment is too hard, and you might need to adjust how you’re testing people’s knowledge.

Simply put, test scores give you a crystal clear overview of how well employees have retained the information and what parts of the training they still need to work on.

The number of certificates earned is a quick way to check whether all employees have finished mandatory training. If they haven’t, it could also be a sign that they found the training either too difficult or boring.

This metric tells you how fast or slow knowledge is retained.
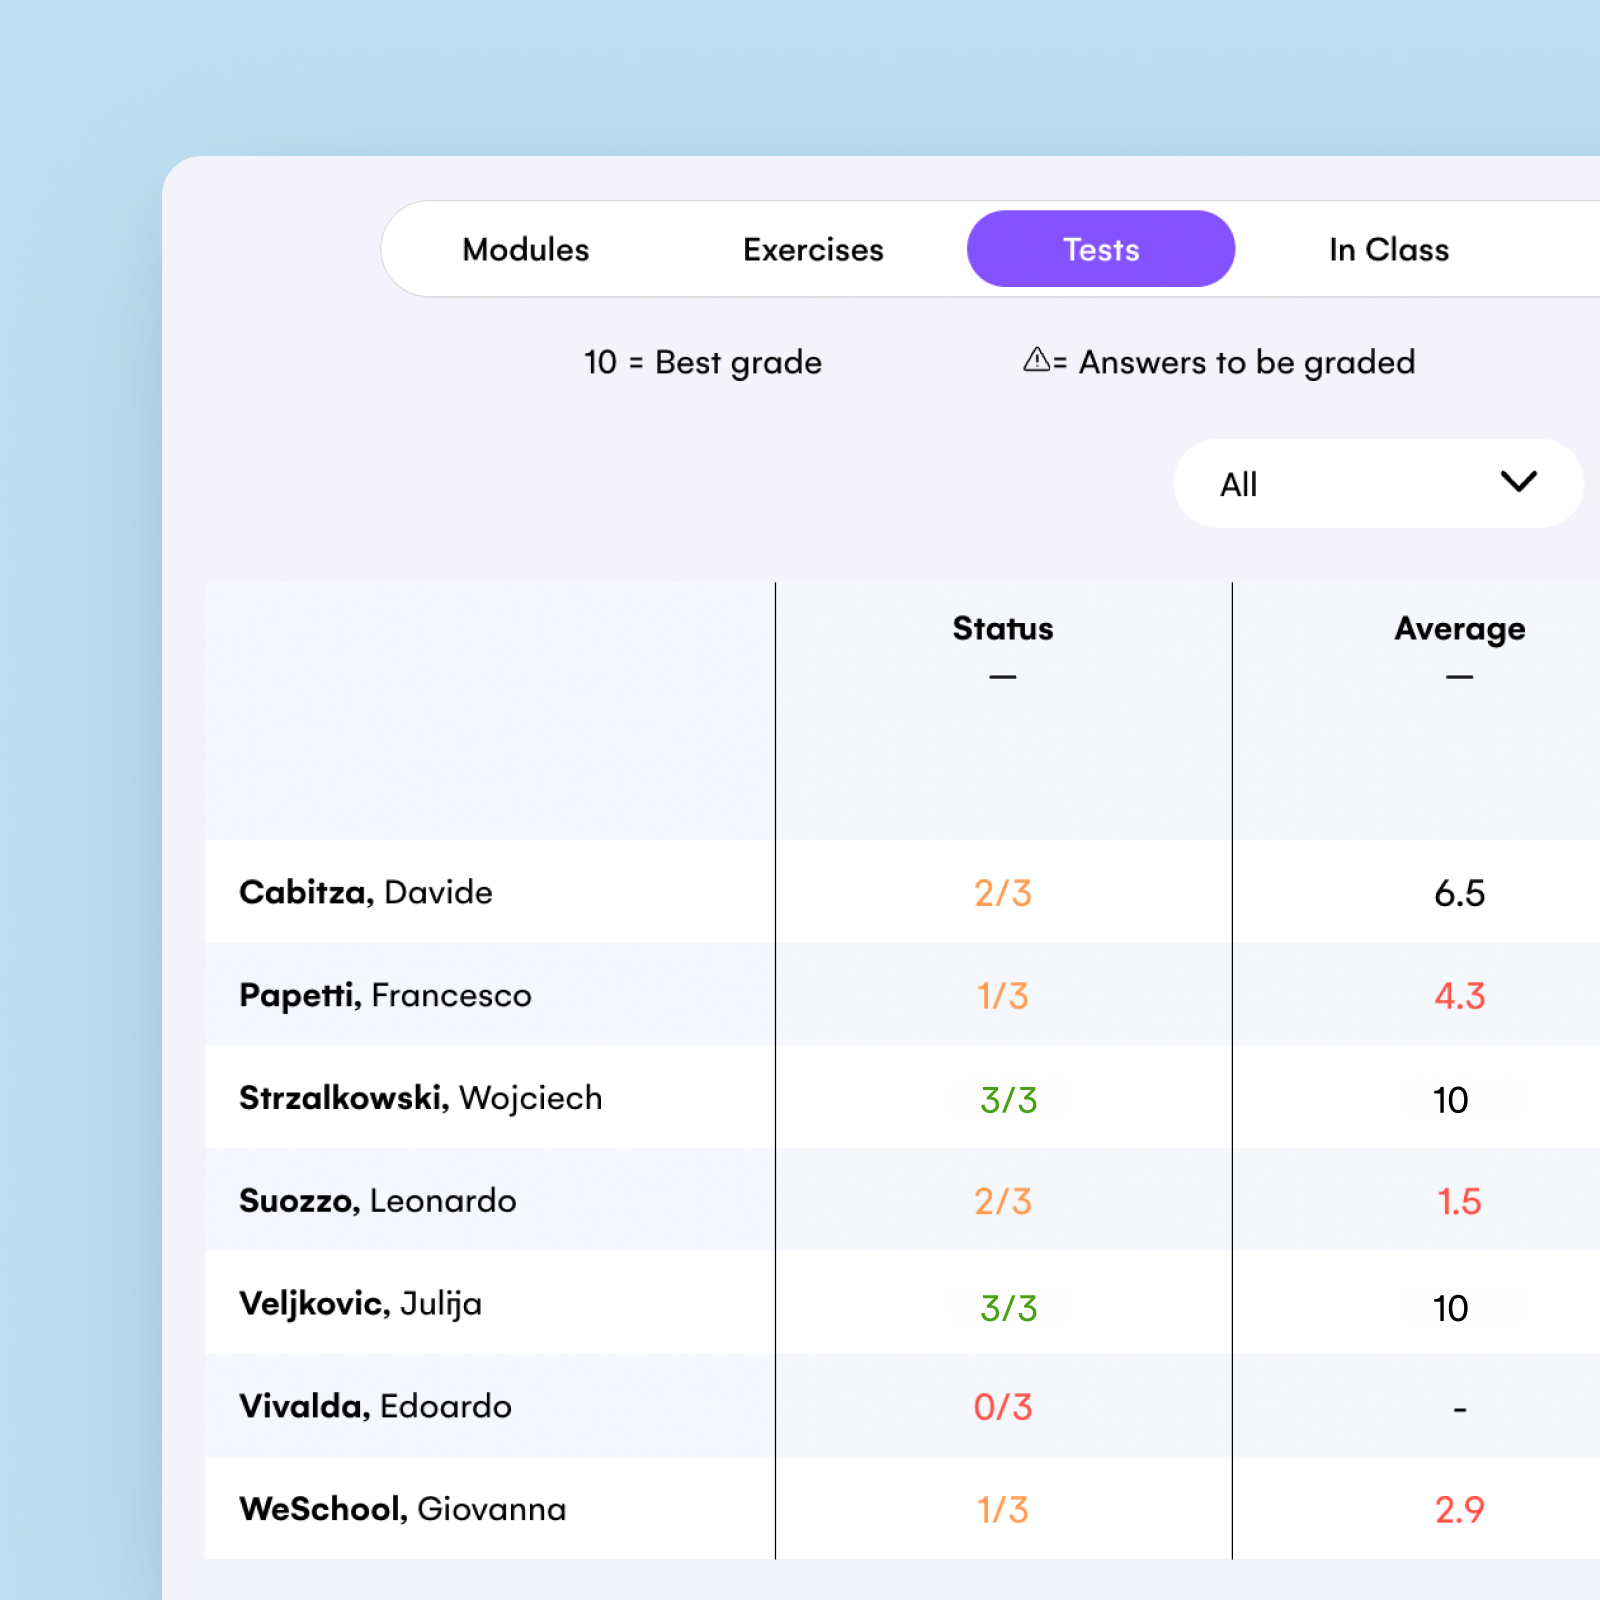
1. Track assessments performance
Monitor assessment and quiz results, including the number of exercises and tests completed by each learner, average grades, best grades, and any questions that need to be reviewed or resubmitted.
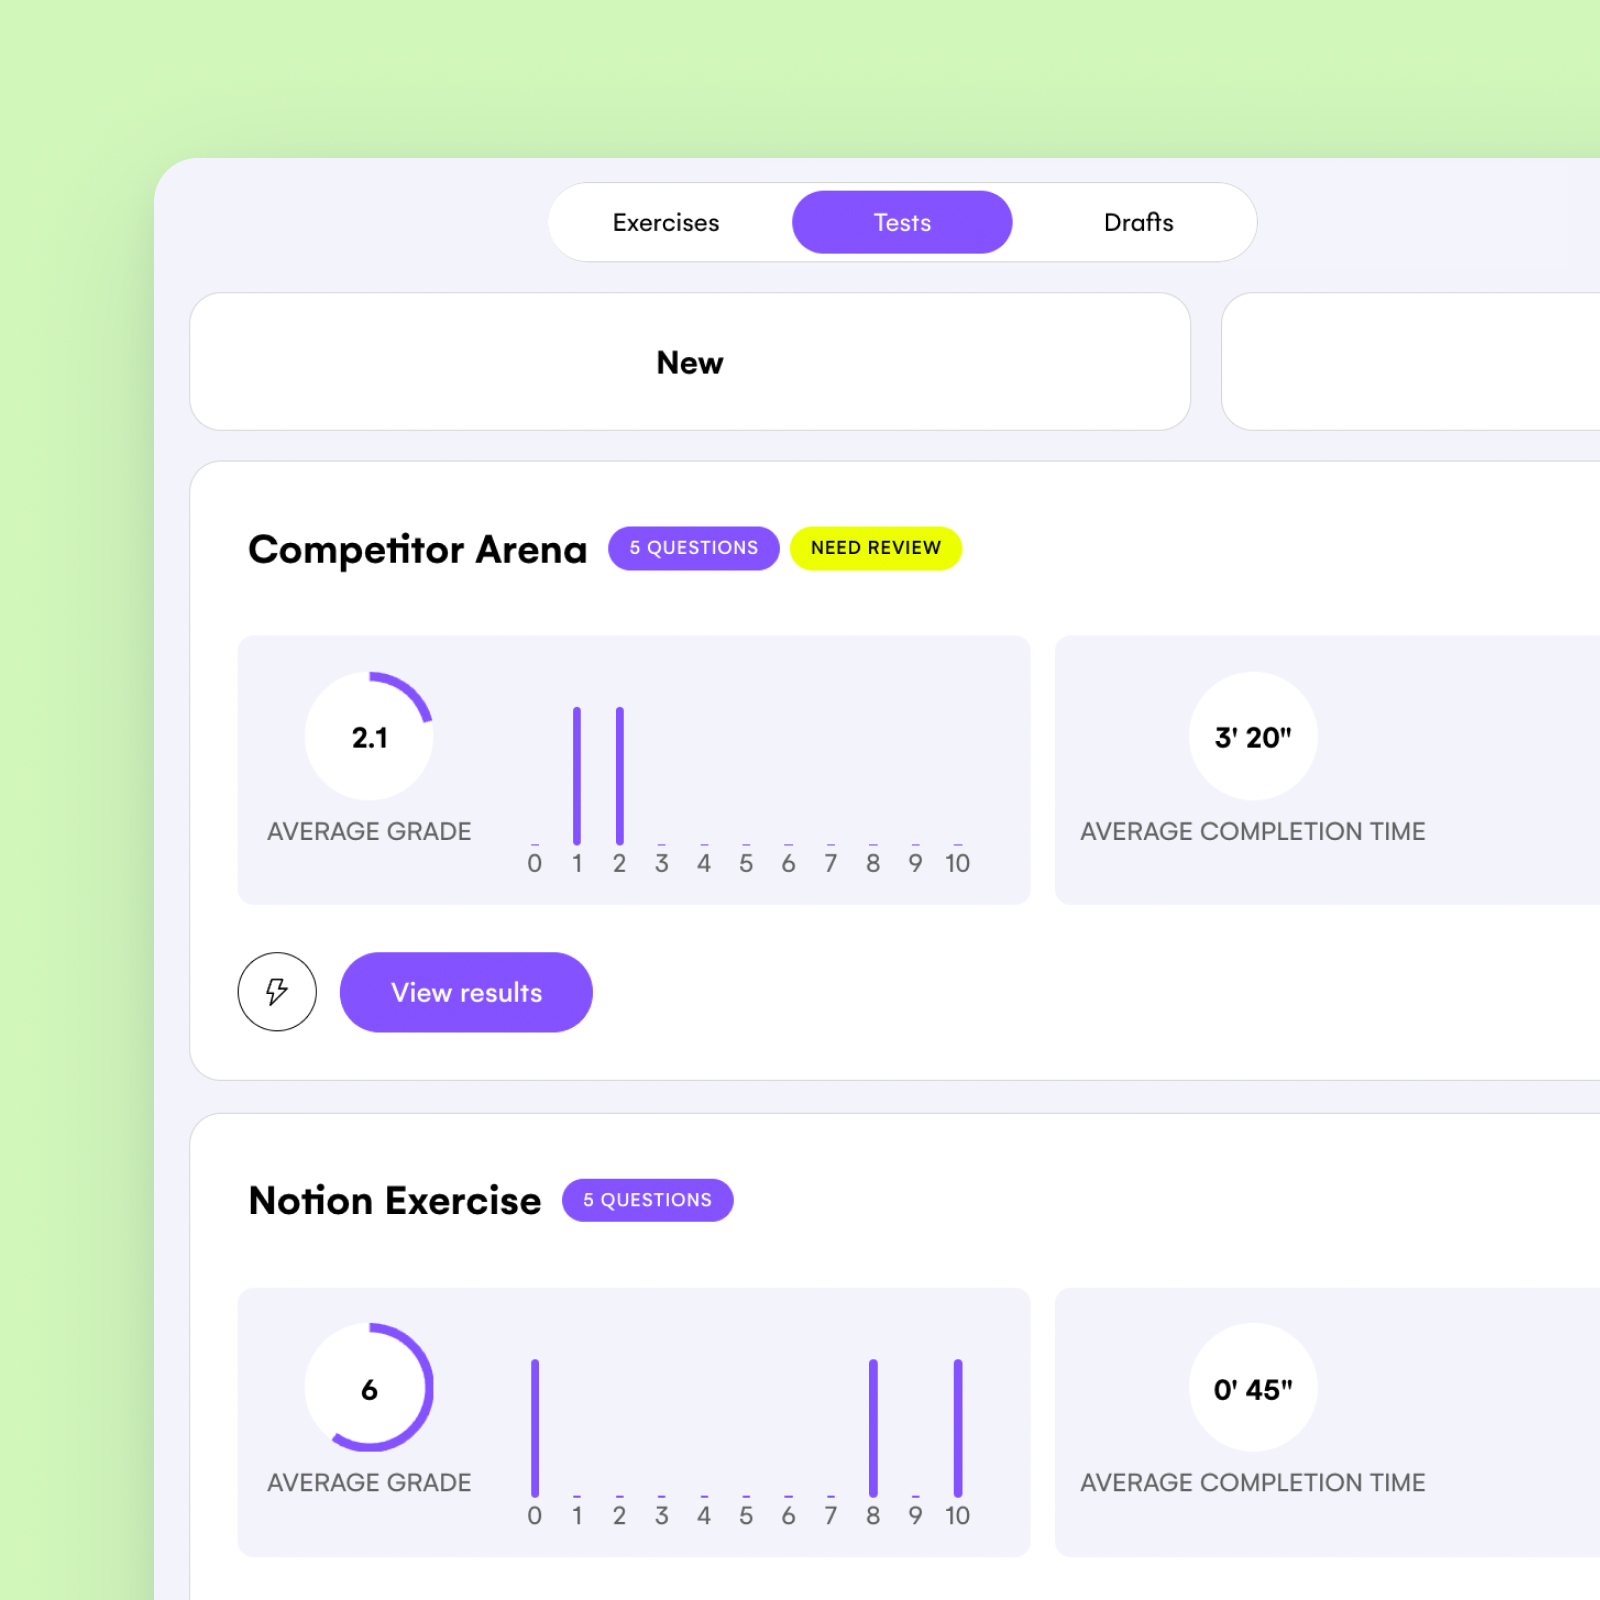
2. Measure students’ learning curve over time
Measure a learner’s performance on a task, including the number of attempts and time required to complete the task, all captured neatly in a graph. Over time, you will be able to see how each student’s learning process develops.
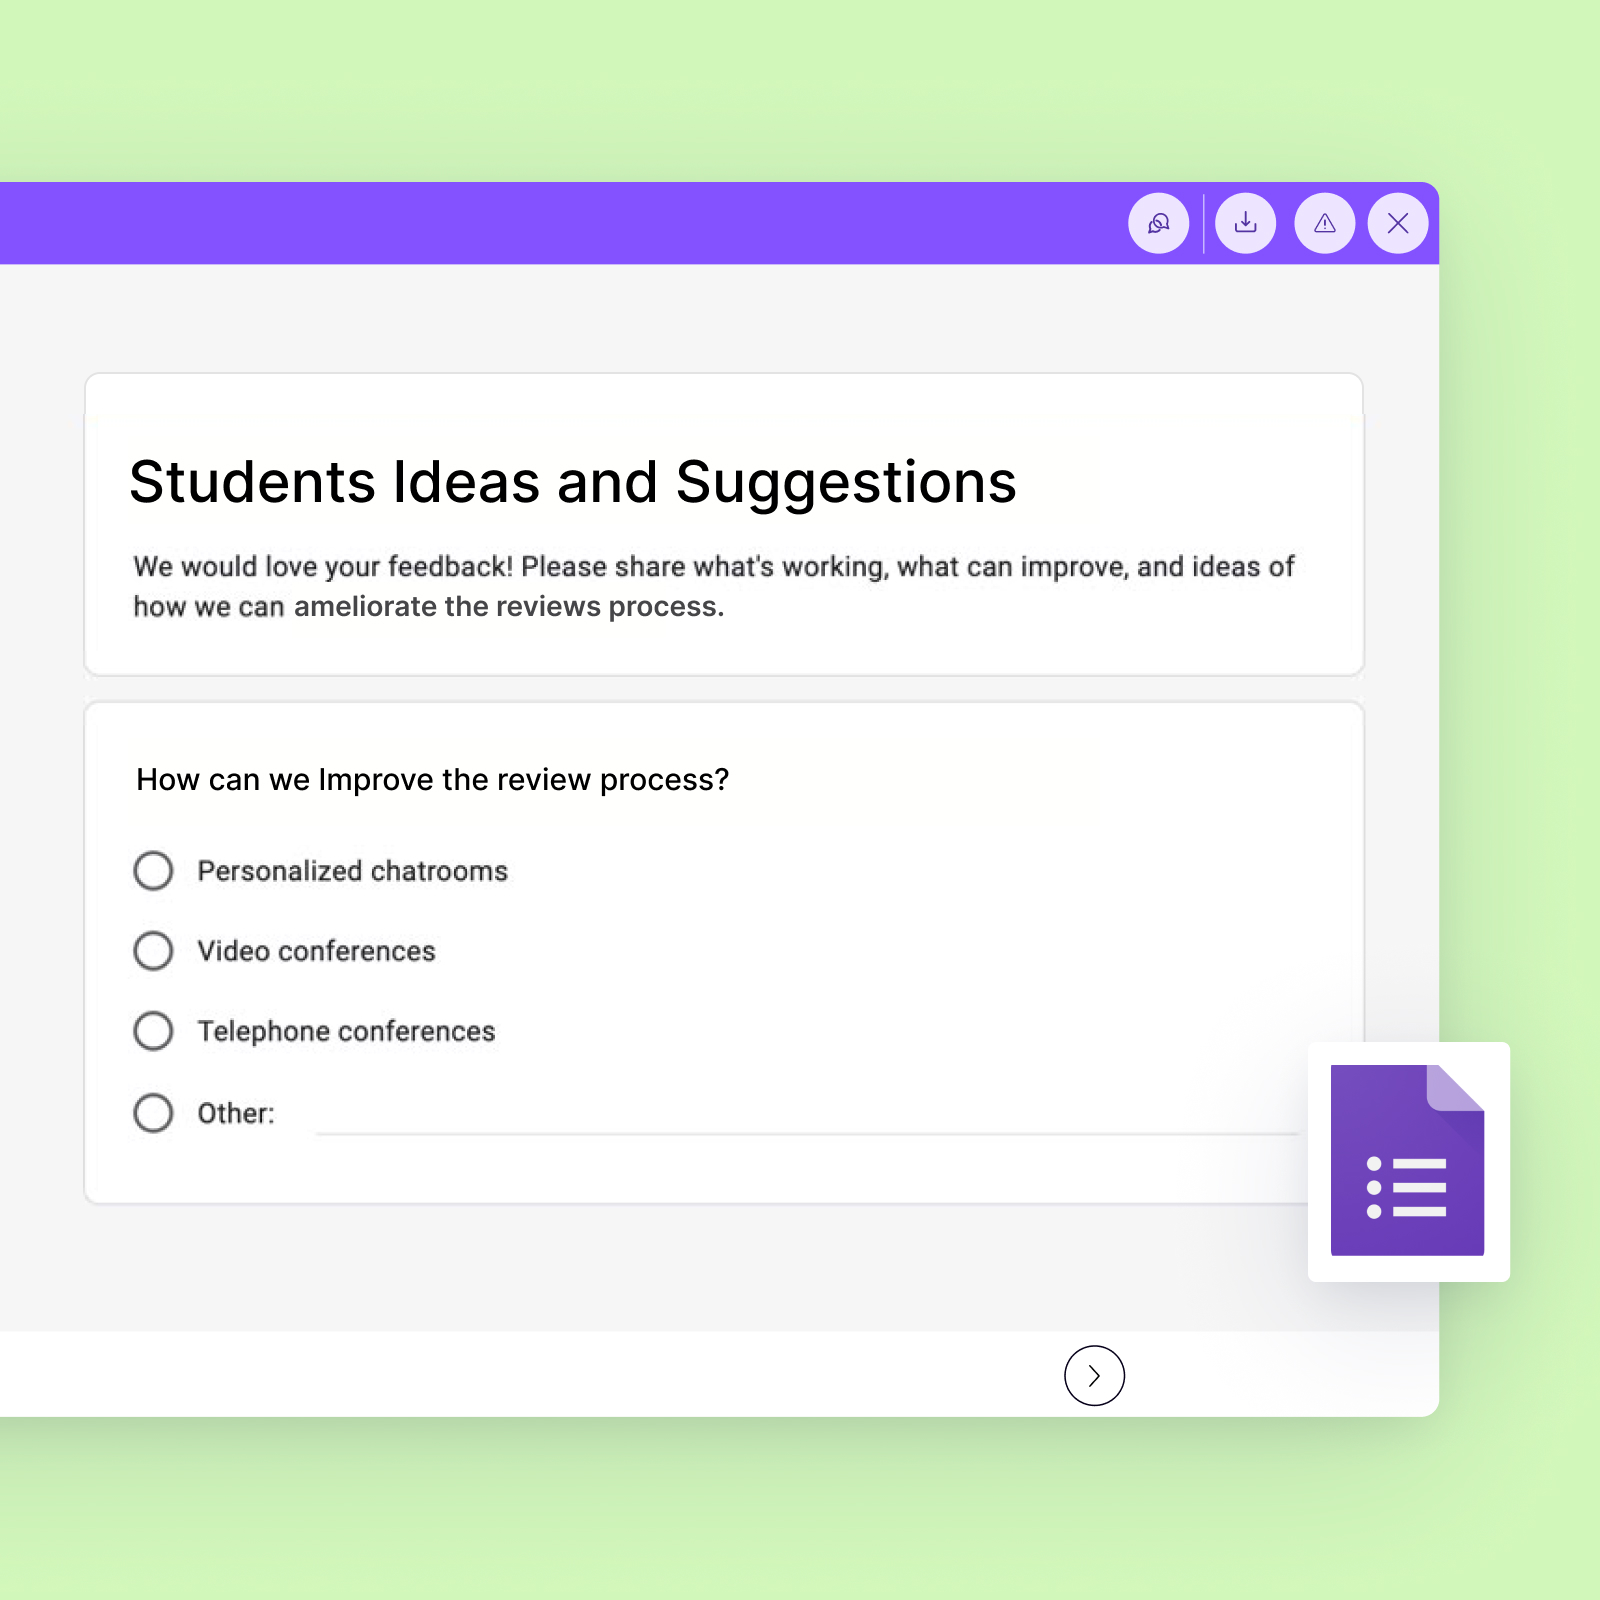
3. Plug in your preferred form and capture qualitative learner feedback
Whether you want to create surveys, carry out assessments, or gather all of your students’ opinions in one centralized place, WeSchool integrates with Google Forms.
Imagine if you could show the outcome of your training program down to each skill a learner has acquired and how it impacts their performance? Skills learned per learner is an outcome measurement, allowing you to prove the success of your L&D program and tie it to business outcomes.
When collecting data on skills development, it’s important to note that L&D impacts every person and department. Therefore, you will likely need to collect data outside of your immediate team and collaborate with other stakeholders to ensure you have access to this type of data. When possible, aim to automate data retrieval — this will save you tons of time.
Your WeSchool learning analytics dashboard gives you an overview of each person participating in your training program, their progress towards skill learning goals, and how many goals have been accomplished.
1. One learning analytics dashboard that rules them all
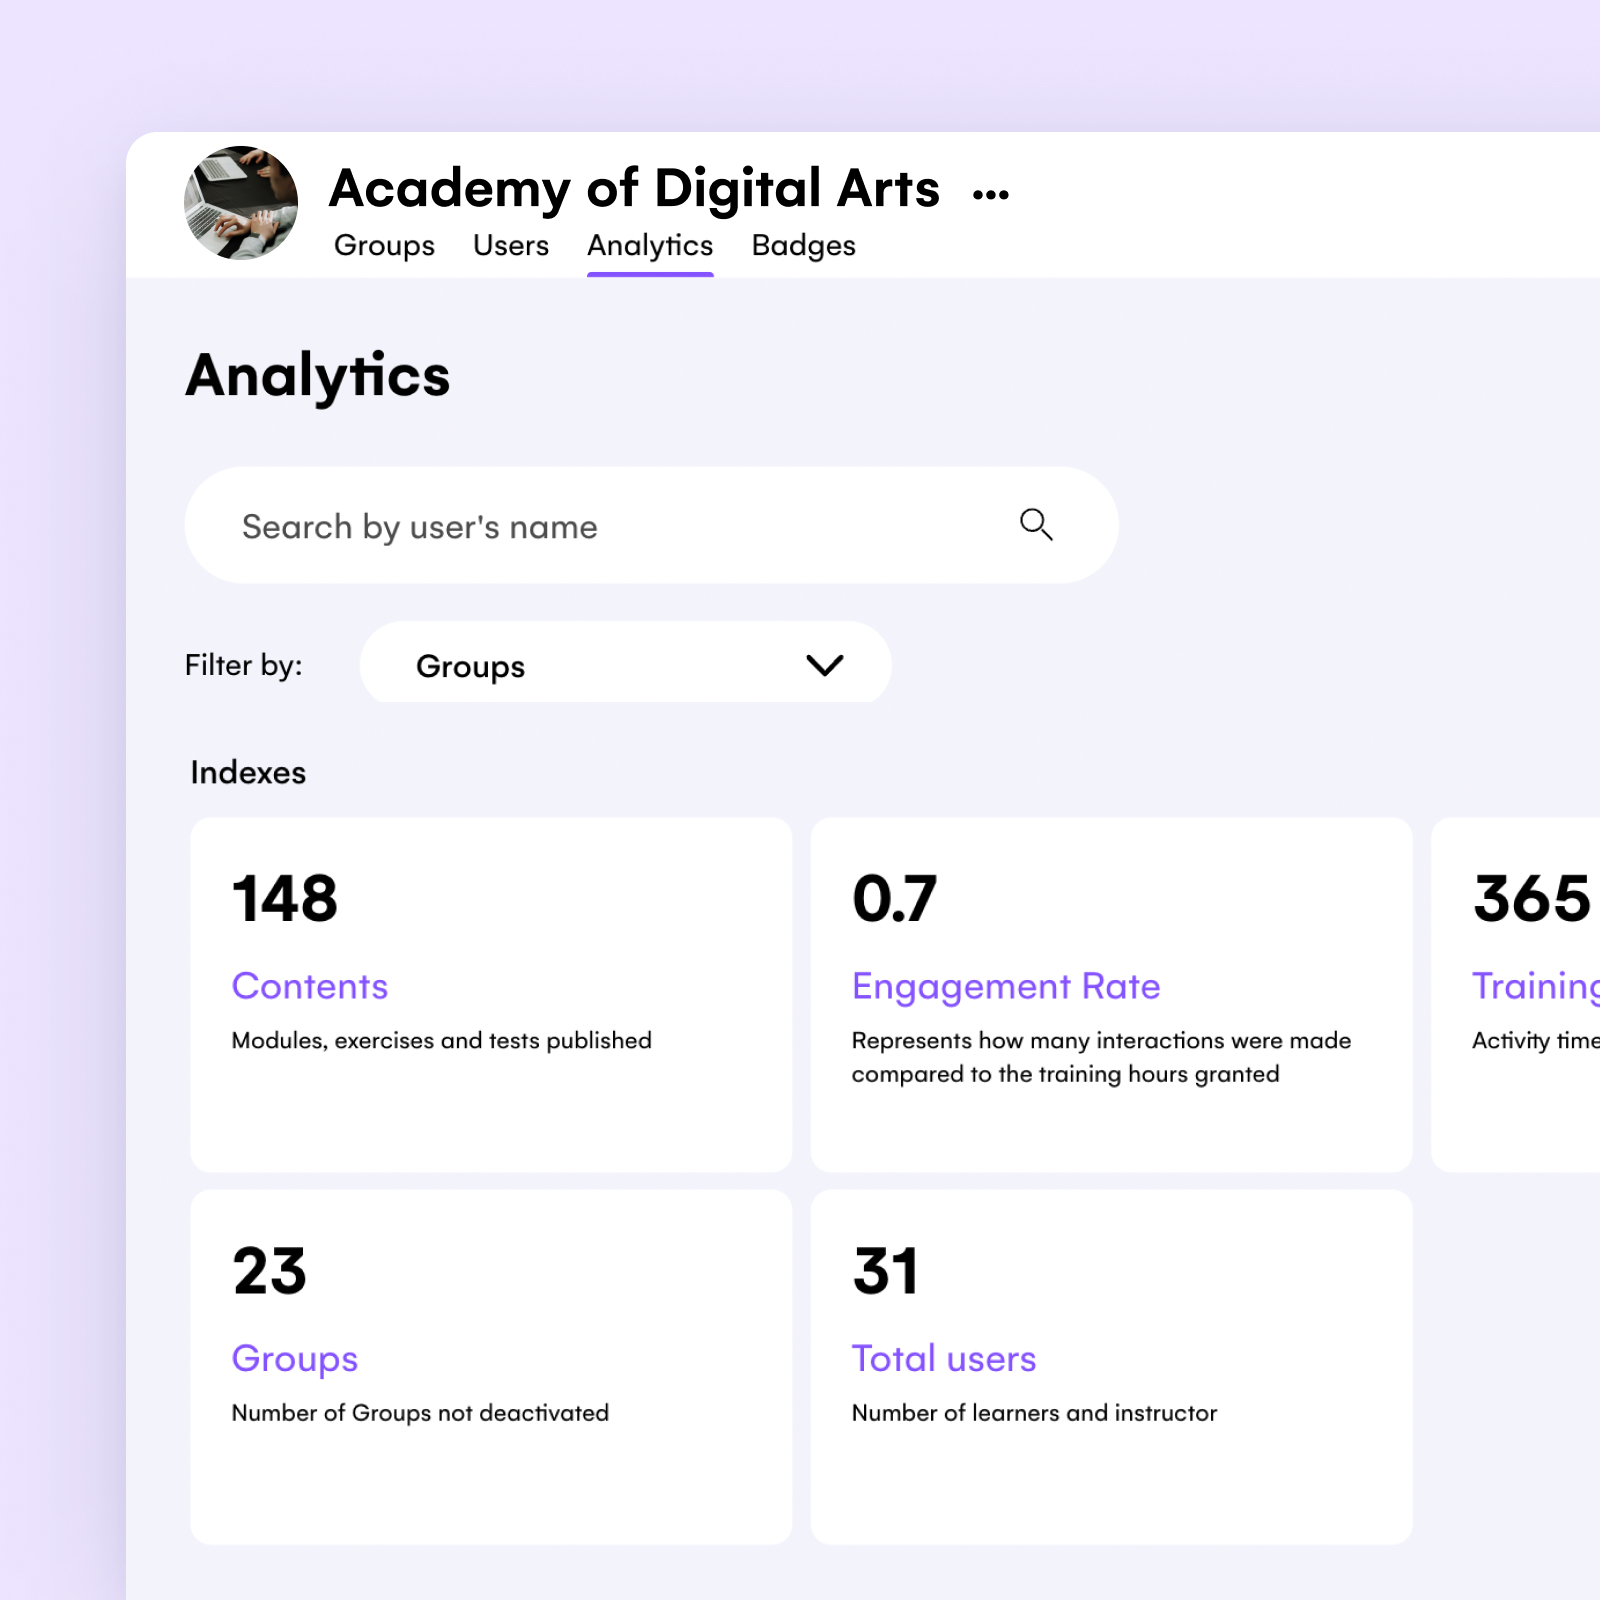
The analytics dashboard provides a 360-degree view of your entire company’s learning activity, with the option to dive deeper into specific groups or individual user reports.
2. See interactions and activities carried out in your company
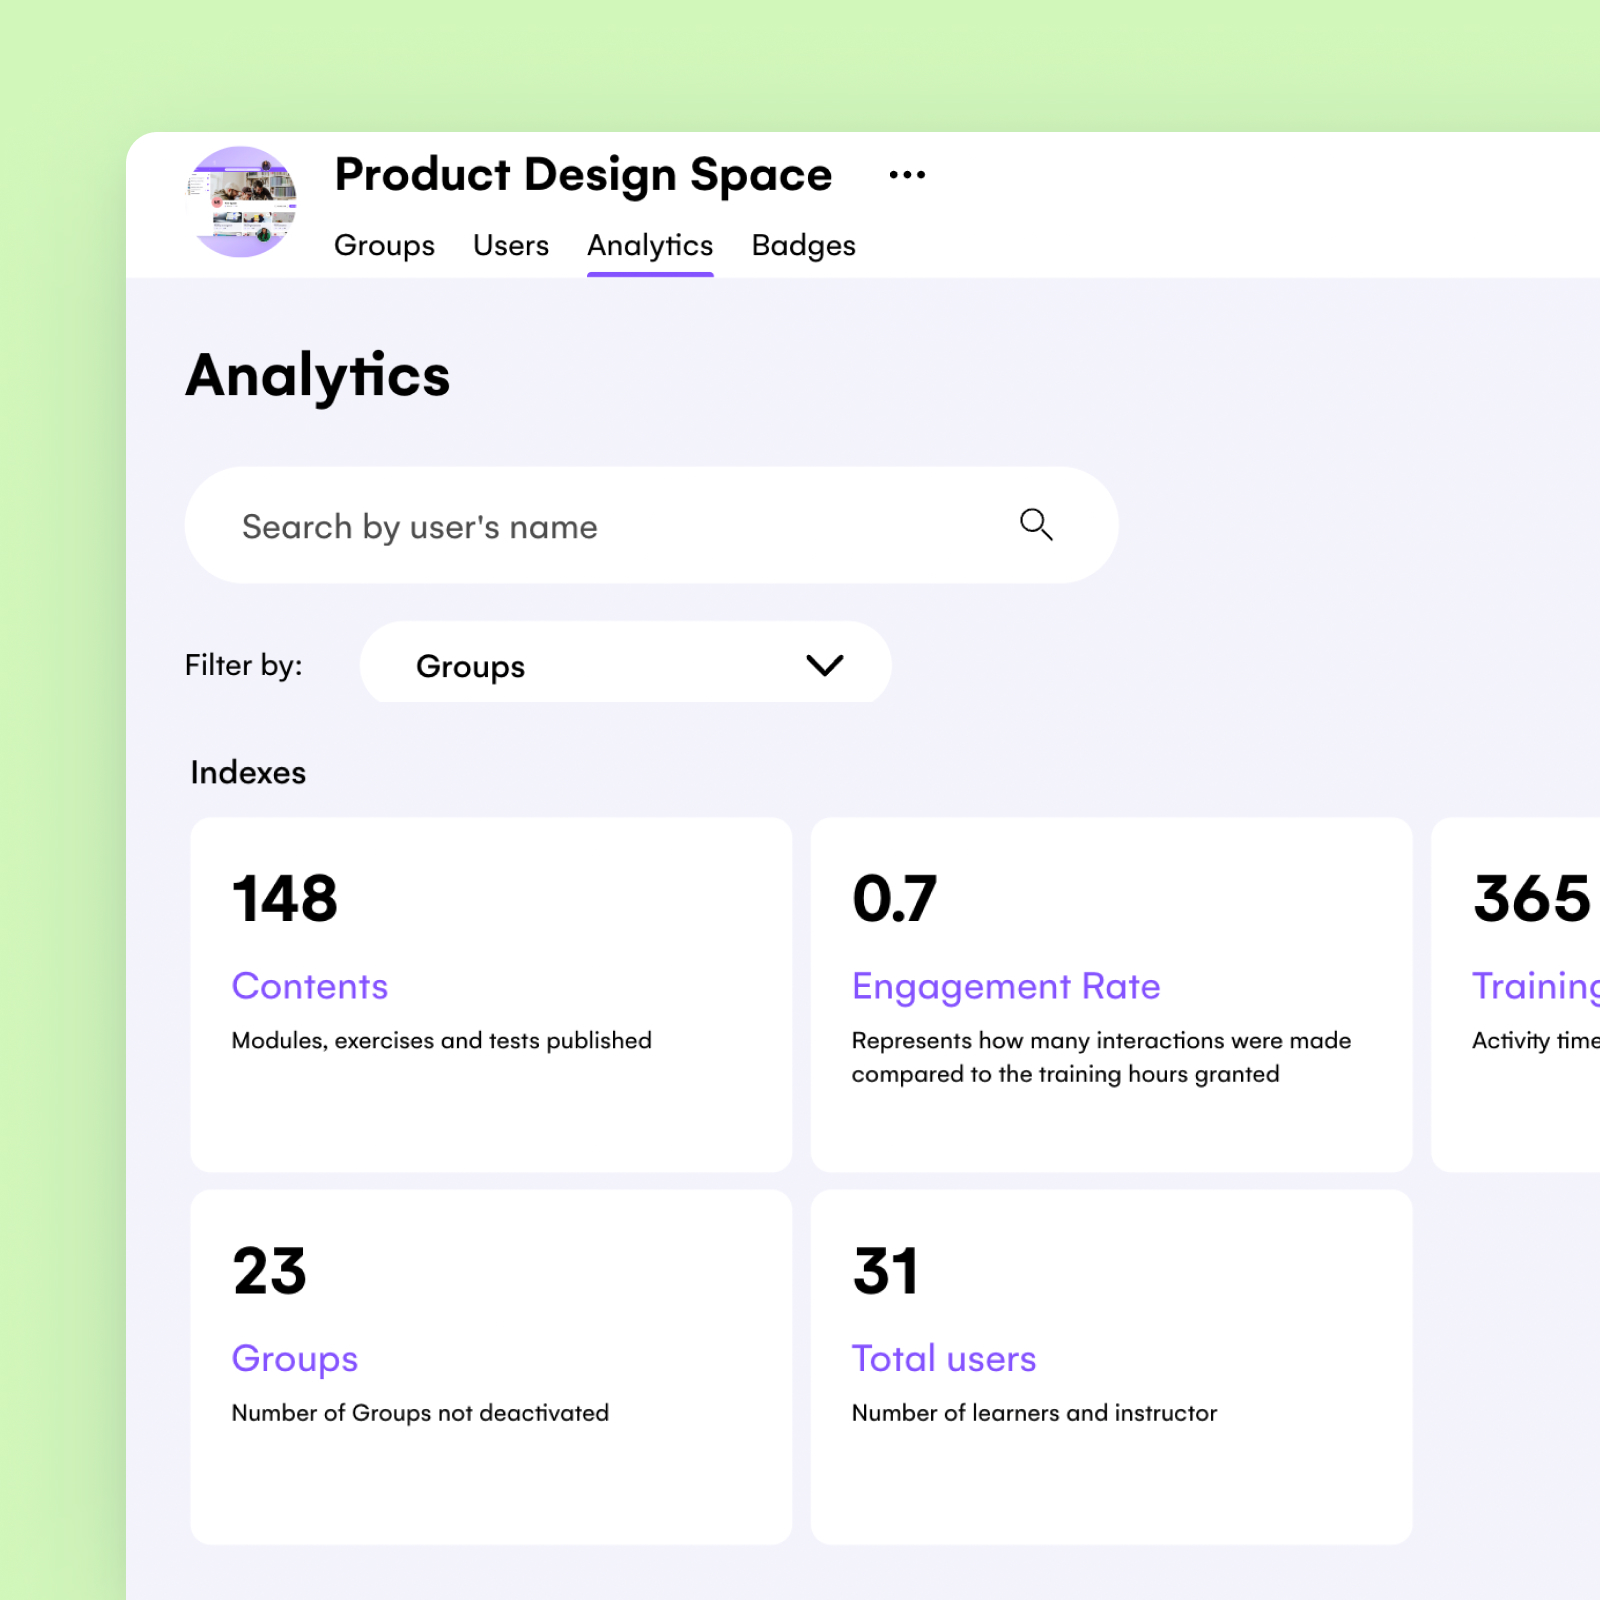
You can see core data under Indexes, including:
- Total amount of content published
- Engagement rate, indicating participation in activities
- Total training hours spent
- Total number of users and active groups associated with your organization
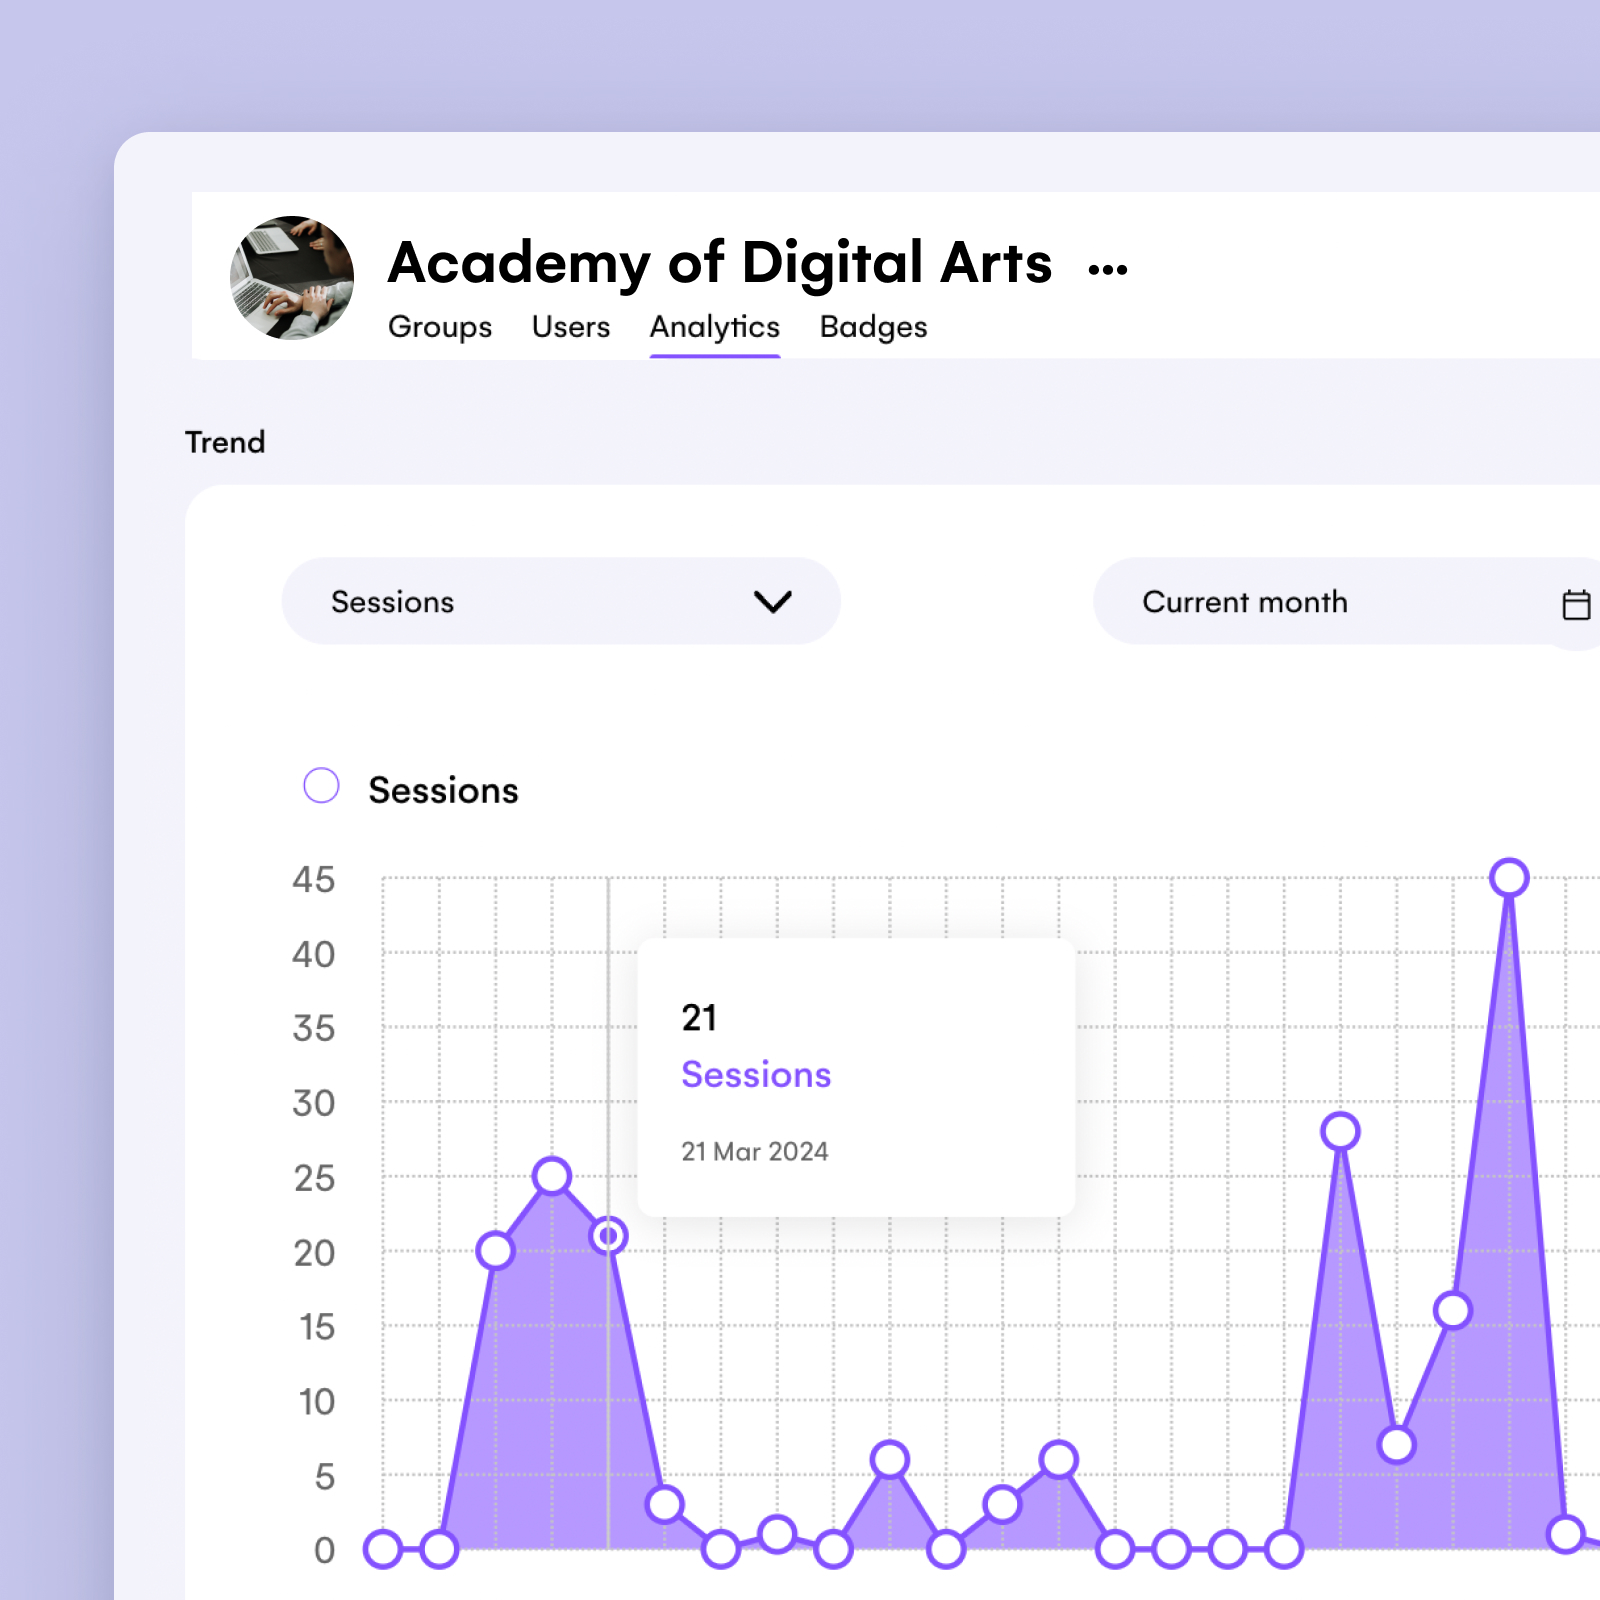
3. View learning trends over time
The analytics section also offers a visual representation of data trends over time. You can choose to view interactions such as posts, comments, sessions, exercises, tests, training hours, and content views across different time frames.
4. Customize your data any way you want
With the Filters option, you can choose to focus on a specific user or group and pick the data most important to you.
Important note: WeSchool’s Analytics Dashboard is only open to pro users.
See WeSchool in action
2 million L&D professionals, teachers, and small businesses like yours use WeSchool to build their learning programs each month.
The success of an L&D program depends on being armed with the right data. Come June 2024, we will release a new and improved learner analytics dashboard, allowing users to see learners’ complete learning journey broken down into digestible graphs and charts.
Users will be able to:
- See how learners are progressing with course material, and what learning gaps they still need to fill
- Track the ROI of their training programs
- Access key metrics like time spent learning and training hours per user, along with each learner’s health score
The ultimate goal? Use data to take informed actions and turn your L&D programs and courses into a smashing success.
WANT TO BE THE FIRST TO USE OUR DASHBOARD? SIGN UP HERE AND YOU’LL BE THE FIRST TO KNOW WHEN WE RELEASE THE FEATURE.
The best way to get the attention of your company’s leaders is to provide metrics that show how your learning program helps the business stay agile, adaptable, and profitable in an ever-changing world.
WeSchool is a user-friendly LMS that supports engaging, interactive learning experiences and automates the most mundane admin tasks. Our platform features learner analytics and reports, plus more. Plan your next L&D training initiative, knowing that your workforce can keep up.

Other resources you might be interested in
-

Make your content feel right at home with WeSchool’s latest product updates
From SCORM integration to customisable assessments and our upcoming sleek and stylish templates, these product boosts will empower you to craft engaging learning experiences with ease and flexibility.
-

AI training pro shares secret recipe for creating realistic AI L&D videos
Discover the proven FOCA framework for creating AI training videos that captivate & educate, directly from AI pro, Kevin Alster
-

How to measure the impact of your L&D strategy with the New WeSchool Dashboard
Enhanced L&D analytics dashboard for data-driven decisions, learning optimization, and impact quantification.


Reviews